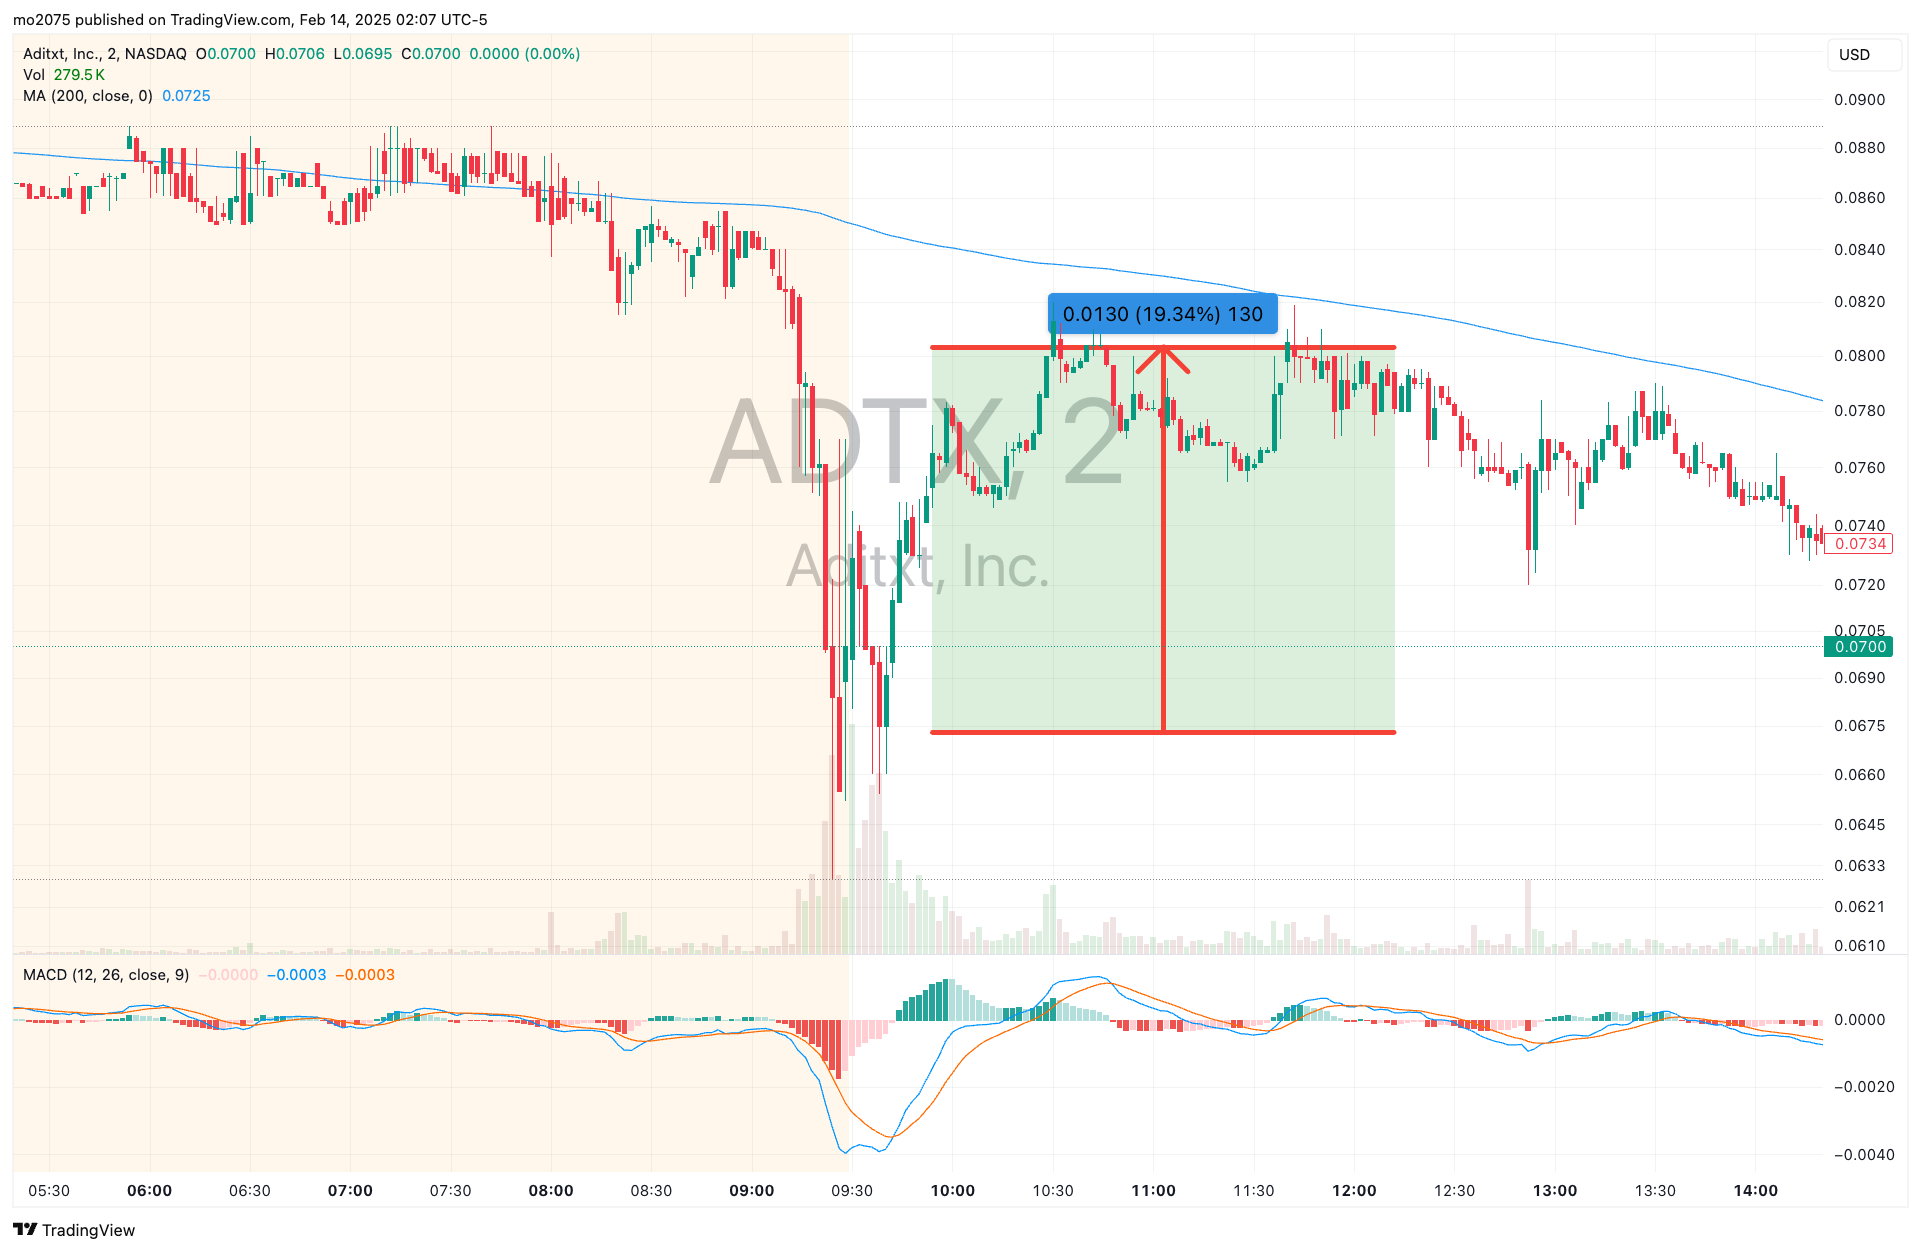
Aditxt, Inc. (ADTX), here is a summary of the price action and technical indicators shown for the period around February 14, 2025:
Price Action & Trends
-
The Big Drop: The chart captures a massive downward gap and sell-off during the morning session (around 09:30). The price plummeted from approximately 0.0860 to a low near 0.0636 in a very short window.
-
The Recovery & Range: Following the crash, the stock saw a significant bounce (highlighted by the green shaded box). This recovery move represents a 19.34% increase ($0.0130), as noted by the measurement tool on the chart.
-
Resistance: After the initial recovery, the stock faced heavy resistance at the 0.0800 level (marked by the red horizontal line). It failed to break back above this point and spent the rest of the day "stair-stepping" lower.
-
Moving Average: The blue line represents the 200-period Moving Average (MA). The stock is trading consistently below this line, which confirms a strong bearish (downward) trend for the day.
Technical Indicators
-
Volume: There was a massive spike in volume during the initial morning crash, indicating high-intensity selling. Volume remained relatively low and "dry" during the afternoon drift downward.
-
MACD (Moving Average Convergence Divergence): * At the bottom of the chart, the MACD shows a deep "valley" during the morning crash.
-
While the MACD lines crossed upward during the mid-morning recovery, they stayed near the zero line for the rest of the session, reflecting a lack of strong buying momentum.
-
Closing Sentiment: The stock ended the session near 0.0716, struggling to find support and showing a "bleeding" pattern where it slowly lost the gains made during its mid-morning bounce.